Performance Metrics in Slot Machines: Analytical Findings from Recent Studies
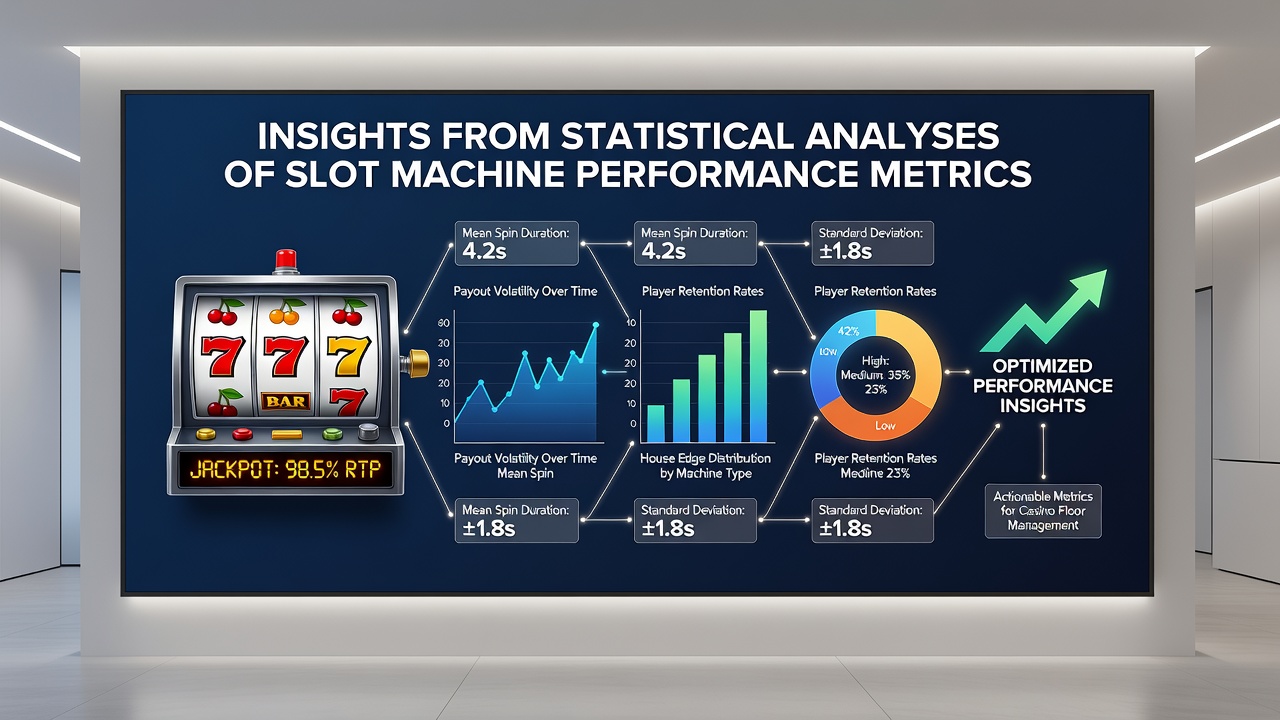
Statistical analyses of slot machine performance metrics provide detailed views into how these games operate over extended periods, with researchers examining return-to-player percentages, volatility indices, and hit frequencies to identify consistent patterns across thousands of spins. Data from regulatory reports in multiple jurisdictions shows that average RTP values for modern video slots often range between 92 and 96 percent, while mechanical reels in land-based venues sometimes report slightly lower figures due to older payout structures. Analysts compile these numbers from large datasets collected by operators and submitted to oversight bodies, allowing comparisons across game types and timeframes.
Return-to-Player Calculations and Regional Variations
Return-to-player calculations form the foundation of most performance studies, where researchers divide total payouts by total wagers across millions of rounds to establish reliable averages. Figures from the Nevada Gaming Control Board reveal that slots in that state maintained an aggregate RTP near 93.8 percent during the 2025 fiscal year, with electronic gaming devices showing minor fluctuations month to month. Similar monitoring in Canadian provinces produces comparable results, although provincial lotteries report slightly different volatility profiles because of local game approvals and tax structures. These metrics help operators adjust floor mixes while giving players transparent information about long-term expectations.
Researchers note that RTP does not guarantee outcomes in short sessions, since random number generators produce independent results on each spin. Studies that aggregate data over six months or longer demonstrate how actual returns converge toward theoretical values, with deviations shrinking as sample sizes grow. One analysis covering more than 40 million spins found that games with advertised RTPs above 95 percent delivered results within 0.4 percentage points of the stated figure after sufficient volume.
Volatility Patterns and Session Length Insights
Volatility measures how widely payouts deviate from the mean, and statistical models categorize slots as low, medium, or high variance based on standard deviation calculations. High-volatility titles produce larger but less frequent wins, whereas low-volatility options distribute smaller amounts more steadily. Performance data collected through 2026 indicates that players who track session length against volatility ratings often see different bankroll trajectories, with longer sessions on medium-variance games showing steadier credit meter movement according to aggregated operator logs.
Hit Frequency and Bonus Trigger Rates
Hit frequency tracks how often any winning combination appears, typically expressed as a percentage of total spins. Analyses of popular online and land-based titles show hit frequencies between 25 and 35 percent for many five-reel games, while bonus rounds trigger at rates between 1 in 80 and 1 in 250 spins depending on the design. Data compiled by the Australian Gambling Research Centre highlights that progressive jackpot slots tend to post lower base-game hit rates because a portion of each wager funds the growing prize pool. These patterns remain consistent across different software providers when examined over equivalent volumes of play.
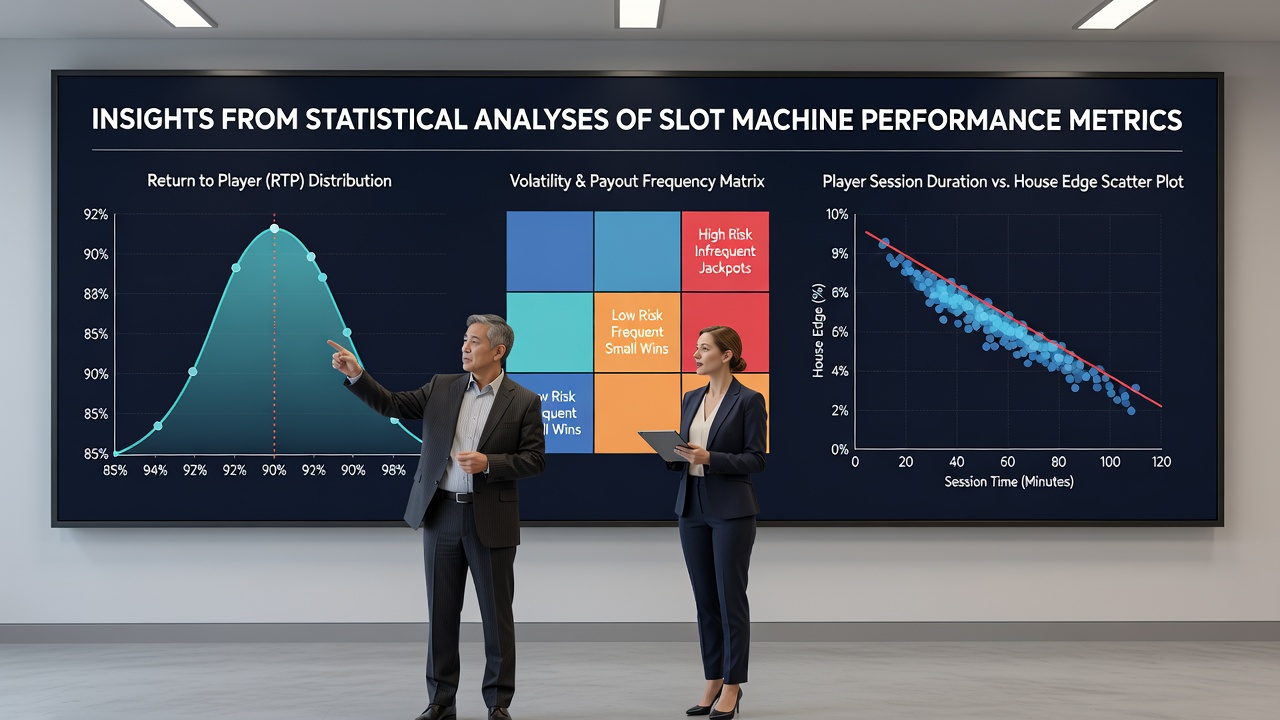
Additional metrics such as average bonus round payout and standard deviation within feature rounds allow deeper segmentation. Researchers who examined July 2026 reporting periods observed that certain themed games released earlier that year exhibited bonus payouts 12 percent above their category averages, though these results came from controlled testing environments rather than live play. Observers note that such spikes often normalize once real-world data accumulates over subsequent quarters.
Comparative Studies Across Platforms
Comparative studies between online and land-based slots show measurable differences in key metrics, particularly in game speed and feature complexity. Online platforms process more spins per hour, which accelerates the convergence of actual results toward theoretical RTP. Reports from the Malta Gaming Authority document that online slots in their jurisdiction average 450 spins per hour during peak times, compared with roughly 600 spins per hour on some physical machines equipped with quick-spin options. These differences affect how quickly performance data stabilizes in statistical models.
Industry organizations track additional variables including coin-in per unit and average bet size, both of which influence overall revenue and player exposure. When researchers control for bet size, volatility rankings remain largely stable across titles, although high-denomination machines sometimes display wider payout swings because of larger maximum bets. Academic papers examining these relationships emphasize the value of large sample sizes drawn from multiple operators to reduce selection bias.
Conclusion
Statistical analyses of slot machine performance metrics continue to supply operators and regulators with precise tools for monitoring game behavior and ensuring compliance with advertised parameters. Data gathered through mid-2026 demonstrates that established patterns in RTP, volatility, and hit frequency hold across diverse markets when sufficient play volume is examined. Continued collection of these metrics supports transparent reporting and helps identify any deviations that warrant further investigation by oversight agencies.